Using Your Branch / Region Report for Planning
A How-To Guide
ESDC Workplace Mental Health Survey 2019 (Updated)
November 12th , 2019
The Purpose of this Guide is to support the organization to understand the results of ESDC’s Workplace Mental Health Survey; identify workplace areas of strength and concern; and use the results to guide its actions.
- Locate Your Results
- Refer to Branch / Region “Change Chart” to review your branch/region workplace mental health survey results. (You need to request this from the WMH Survey Team directly).
- Understand Your Results
- Read through each item reported
- Where is your branch / region strong?
- What are areas in need of improvement?
- Are there any factors of particular concern?
- Use the legend as a guide:
- No concern
- Moderate concern
- High concern
- Read through each item reported
- Identify Key Predictors and Compare to Results
- Using your report, which of the 5 outcomes are of particular concern for you?
- What factors influence each outcome? See “The Model of Main Drivers” below.
- Are any of the predicting factors areas of concern for your branch or region? Check your results for
- No concern
- Moderate concern
- High concern
- Using your report, which of the 5 outcomes are of particular concern for you?
- Determine Where to Focus Your Efforts
- See the “Mapping Actions to Findings” charts below
- There are two versions: Three are portfolio specific with 2019 results (to be used as examples), and one is blank (you can use for your own results).
- Look at your results. Depending on whether it is green, yellow or red (identified on your Change Chart, far right hand column), write the name of each factor in the appropriate row and column.
- One approach: tackle the factors in the yellow and red zones.
- Based on the key predictors (from step 3), which factors are in the yellow or red zones? Start with those.
- What other factors are in the yellow and red zones (step 4)? Move to these next.
- Some factors are important predictors for more than one outcome: consider working on those because you will get more ‘bang for your buck’.
- Note: Don’t lose sight of factors in the green, healthier range. These can be important catalysts for sparking improvement in other workplace factors.
- See the “Mapping Actions to Findings” charts below
- Plan
- Now that your branch’s/ region’s results are organized, here are some questions to ask:
- How do these results resonate with what else you know about your organization? What your team knows? Other survey results?
- Which outcome(s) do you want to focus on?
- Brainstorm actions and activities.
- What is already being done? What’s missing?
- Talk to your Workplace Mental Health Champion: What are other teams, branches/regions doing?
- Are you focusing your actions/activities at the right level: Job demands? Factors relating to the individual? The team? The organization?
- Now that your branch’s/ region’s results are organized, here are some questions to ask:
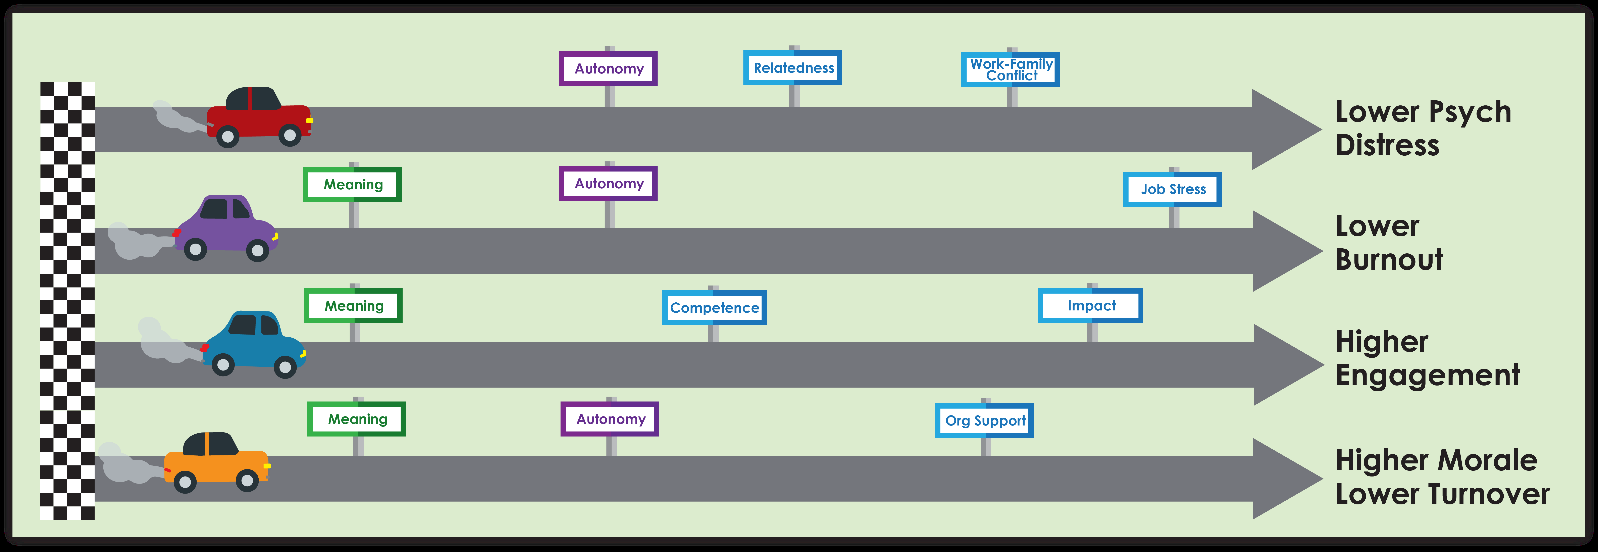
Model of Main Predictors for Each Workplace Outcome, ESDC
The top three predictors for each of the five outcomes are represented below. The outcome of interest is at the end of each ‘road’, and the three strongest predictors (either job demands or job resources) are “signs” along the way. Notice that Morale and Turnover both have the same key predictors (and for simplicity, they share a road).
For example:
- Risk for Psychological Distress is most strongly predicted by Autonomy, Relatedness, and Work-Family Conflict.
- Burnout is most strongly predicted by Meaning, Autonomy and Job Stress.
- Engagement is most strongly predicted by Meaning, Competence and Impact.
- Morale and Turnover Intentions are most strongly predicted by Meaning, Autonomy and Organizational Support.
Mapping Actions to Findings – Blank
- Use this page if you are working with branch/region results.
| Workplace Factors | Job Demands | Job Resources | Outcomes | ||||
|---|---|---|---|---|---|---|---|
| Individual | Team | Leader | Organization | ||||
| Work-family Conflict Workload Job Stress | Competence Meaning Autonomy Impact | Relatedness Psychological Safety Civility and respect | Role Clarity Leadership Recognition | Organizational Support Group Culture | Engagement Turnover Intentions Morale Burnout Psychological Distress | ||
| Concerned level | No | ||||||
| Moderate | |||||||
| High | |||||||
Mapping Actions to Findings – Employment and Social Development
Use Portfolio results if your branch/region responses were too low to generate your own report. ESD’s results are mapped below.
| Workplace Factors | Job Demands | Job Resources | Outcomes | ||||
|---|---|---|---|---|---|---|---|
| Individual | Team | Leader | Organization | ||||
| Work-family Conflict Workload Job Stress | Competence Meaning Autonomy Impact | Relatedness Psychological Safety Civility and respect | Role Clarity Leadership Recognition | Organizational Support Group Culture | Engagement Turnover Intentions Morale Burnout Psychological Distress | ||
| Concerned level | No | Work-family Conflict | Competence Meaning | Psychological Safety Civility and respect | Leadership | Organizational Support Group Culture | Engagement |
| Moderate | Workload | Autonomy | Relatedness | Role Clarity Recognition |
Turnover Intentions Morale |
||
| High | Job Stress | Impact | Burnout Psychological Distress |
||||
Mapping Actions to Findings – Service Canada
Use Portfolio results if your branch/region responses were too low to generate your own report. Service Canada’s results are mapped below.
| Workplace Factors | Job Demands | Job Resources | Outcomes | ||||
|---|---|---|---|---|---|---|---|
| Individual | Team | Leader | Organization | ||||
| Work-family Conflict Workload Job Stress | Competence Meaning Autonomy Impact | Relatedness Psychological Safety Civility and respect | Role Clarity Leadership Recognition | Organizational Support Group Culture | Engagement Turnover Intentions Morale Burnout Psychological Distress | ||
| Concerned level | No | Competence Meaning | Civility and respect | Role Clarity | Engagement | ||
| Moderate | Workfamily Conflict Workload |
Psychological Safety Relatedness |
Leadership | Organizational Support Group Culture |
Turnover Intentions Morale |
||
| High | Job Stress | Autonomy Impact |
Recognition | Burnout Psychological Distress |
|||
Mapping Actions to Findings – Labour Program
Use Portfolio results if your branch/region responses were too low to generate your own report. Labour Program’s results are mapped below.
| Workplace Factors | Job Demands | Job Resources | Outcomes | ||||
|---|---|---|---|---|---|---|---|
| Individual | Team | Leader | Organization | ||||
| Work-family Conflict Workload Job Stress | Competence Meaning Autonomy Impact | Relatedness Psychological Safety Civility and respect | Role Clarity Leadership Recognition | Organizational Support Group Culture | Engagement Turnover Intentions Morale Burnout Psychological Distress | ||
| Concerned level | No | Competence Meaning |
Psychological Safety Civility and respect |
Leadership | Organizational Support Group Culture |
Engagement | |
| Moderate | Workfamily Conflict Workload |
Autonomy | Relatedness | Role Clarity Recognition |
Turnover Intentions Morale |
||
| High | Job Stress | Impact | Burnout Psychological Distress |
||||