Workforce Demographic Profiles (WDP) Methodology
Introduction
The Workforce Demographic Profiles (WDP) provide information on the composition and characteristics of ESDC's workforce. The reports are designed to help address the needs of managers for succinct and pertinent facts about their workforce. The WPD, enables stronger, evidence-based HR management decisions and to support resource allocation decisions linked to business priorities.
| Profile | Theme |
|---|---|
|
L1 (Dept) |
1-7 |
|
L2 (Portfolio) |
1-6 |
|
L3 (Branches and Service Canada Regions) |
1-6 |
Workforce Demographic Profiles Data
- Data for the previous quarter is extracted on the first day of every new quarter (April 1st, July 1st, Oct 1st, and Jan 1st). Comparison is made with the previous 3-4 quarters.
- The profiles use source data from ESDC's myEMS (PeopleSoft). In the departmental report, some tables and graphs include the Core Public Administration (CPA) data in order to compare ESDC with the CPA. Historical quarterly data consists of previous snapshots from the end of each fiscal quarter.
- New employees who started with ESDC prior to the first day of the quarter and whose information has not yet been entered into myEMS(PeopleSoft) are excluded.
- Unless otherwise specified, the ESDC population includes indeterminate employees, term employees of three months or more and seasonal employees.
- For privacy reasons, information is not shown for occupational groups with fewer than 10 employees.
- An employee's substantive position reflects their base position within the organization, while an employee's current position reflects their acting role; both position types are used as data sources for the report.
Employee Occupational Groupings
- The following occupational groups represent 97% of ESDC's population: AS, CR, CS, EC, EX, FI, IS, NU, PE and PM.
- "Other" refers to the following occupational groups which represent 3% of ESDC's population: AM, CH, CO, DA, DD, DM, ED, EG, EL, EN, FB, GL, GS, GT, LA, LS, MD, MS, NO, OC, OM, PG, PL, ST and TI.
ThemesThemes
- Demographic
- Purpose: display demographic information about employees including distribution of age groups, years of service, as well as geographic location.
- In certain cases, as indicated in footnotes, filters may be applied to data to include only indeterminate employees.
- Data for geographic information from employees' 'current status.'

- Formulas :
- Distributions: calculated by expressing the percentage (%) of total count of individual employees with 'substantive status' falling under each category (years of service, age group, and regional intervals).
- Averages: simple average of metric in question (years of service, age, region) over the count of individual employees in each occupational group.
- Purpose: display demographic information about employees including distribution of age groups, years of service, as well as geographic location.
- Departure Rate
- Purpose: Identify groups most likely to lose more employees than overall organizational rate, identify primary reasons for departure.

- Data is filtered to include only indeterminate and seasonal employees.
- Data generated by appending a summary of departures for employees leaving substantive status to employees with substantive status in Q4 of last year.
- Within occupational groups, columns are colour-coded, showing the distribution of different departure reasons.
- Formulas :
- Employees are segmented into occupational groups and each group's departure subtotal is divided by the count of employees present during the preceding 4th financial quarter.
- Overall departure rate calculated by dividing the count of individual employees left since Q4 (last year) by count of individual employees in previous Q4.
- Purpose: Identify groups most likely to lose more employees than overall organizational rate, identify primary reasons for departure.
- Retirement Eligibility
- Purpose: Forecast cumulative eligible retirements by occupational groups in coming years.
- Generated using 'substantive status' as data source.
- Data is filtered to include only indeterminate employees.
- Formulas :
- Count of individual employees eligible to retire in 20xx divided by total number of employees in current quarter.
- Highlight applied to graph bars to show distribution of employees by eligible retirement years.

- Purpose: Forecast cumulative eligible retirements by occupational groups in coming years.
- Official Language Analysis
- Purpose: Identify occupational groups with gaps in language requirements, forecast when second language evaluation results expire, and identify predominately spoken first language by organization. Generated with data from 'substantive status' field.
- Data is filtered to include only indeterminate, seasonal employees, and terms greater than three months. Additional filter applied to include only employees whose position requires bilingual status and to exclude those whose results are not listed.
- Formulas :
- Percentage of employees not meeting language requirements by occupational group: number of employees in each occupation group not meeting language requirements, divided by the sum of employees who failed and those who succeeded.
- Employees meeting position language requirements by occupational group follows the same formula structure: count of individual employees who passed divided by total employees in current quarter.
- Expired SLE results are analyzed by dividing the number of employees whose test results have expired by the number of employees with valid and expired results.
- First official language is calculated by expressing the percentage of total count of employees citing French or English as their first official language respectively.

- Purpose: Identify occupational groups with gaps in language requirements, forecast when second language evaluation results expire, and identify predominately spoken first language by organization. Generated with data from 'substantive status' field.
- Employment Equity Analysis
- In the Employment Equity (EE) section, each unit represents one employee.
- Gaps represent the number of employees that need to be hired to satisfy the EE Workforce Availability requirements.
- Workforce Availability (WFA) represents the population available for a specific position within a specific region. WFA is measured by the population in the 2016 Census.
- Population: Indeterminate employees, term employees of three months or more and seasonal employees. Only 'substantive status's positions are included.
- EE representation data is sourced from the CPA Employment Equity Data Bank (EEDB), which is populated with self-identification information provided by employees, plus the data from separate agencies' reports to Parliament.
- Leave Without Pay (LWOP) and Sick Leave Usage
- Purpose: Assess trends in employee Leave without Pay (LWOP) usage, distribution of employees on LWOP by reason cited, and average count of sick days used per occupational group. Generated with data from appended LWOP data set.
- Data filtered to include indeterminate, seasonal, and employees with terms greater than 3 months.
- Formulas :
- Trend in LWOP: Count of individual employees on LWOP over total count of employees (in their substantive positions) per quarter.
- Trend in LWOP by 'reason': Count of individual employees on LWOP for illness and disability over total count of employees per quarter.
- Average sick days per occupational group: Using appended leave data set; sum of sick days taken per group over the total count of employees per quarter.

- Purpose: Assess trends in employee Leave without Pay (LWOP) usage, distribution of employees on LWOP by reason cited, and average count of sick days used per occupational group. Generated with data from appended LWOP data set.
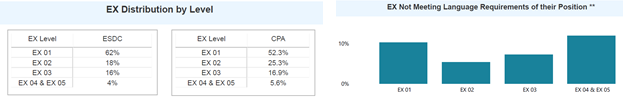
- Executive Analysis
- Executive-based metrics are created in the same fashion as metrics for the general population of employees with filters applied to only include executive level employees.
- Generated with data from substantive status field.
- Formulas :
- Executives are filtered into groups based on level, and percentages are calculated by taking count of individual executives at each level over total count of executives.
- Annex A: Overall OL Summary
- Generated with data from substantive status field dated end of current quarter.
- Filtered to include only indeterminate and term employees.
- Results are grouped by region and portfolio.
- Formulas :
- Bilingual: Count of individual employees who are bilingual over the number of employees in substantive position.
- Unilingual: Count of individual employees who are unilingual over the number of employees in substantive position.
- Meet Language Requirements: Subset of bilingual employees with substantive status, 'Meet' represents a count of individual employees who meet official language requirements of substantive position over total substantive positions with language requirements.
